By Brian Nelson, M.Sc.,
Diary Specialist
Grand Valley Fortifiers
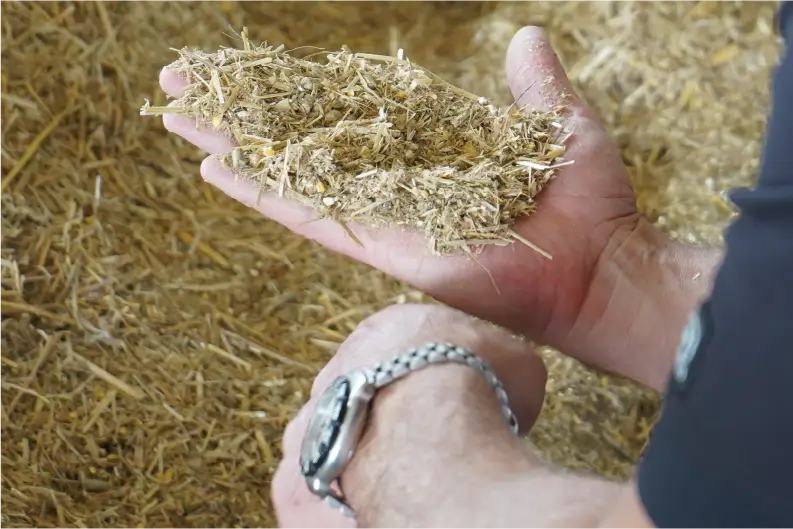
With first cut haylage only a couple months away, I wanted to look at how forage quality impacts overall ration costs. The goal is always to produce high quality forages to supply large amounts of energy and protein in addition to digestible fibre, to promote high milk production, healthy cows, and help lower feed costs. However, the summer of 2023 was challenging as the lack of sunshine, smoke from forest fires, and frequent rains prevented many of us from making our best haylage.
Overall, 2023 can be summarized as a year with lots of average or slightly below average haylage that needs to be fed. Fortunately, this has resulted in strong butter fat test across the province, due to higher amount of fibre in the rations and slower rate of fibre digestion. However, this does create some additional ration costs to maintain the targeted level of milk production. For interest, let’s consider 3 rations with different qualities of mixed haylage and the impact on overall ration costs. In this example all 3 rations use all the same ration ingredients, the only difference being haylage quality. These rations were balanced 50-50 with corn silage and haylage on a dry matter basis. For simplicity of comparison, all protein and minerals were assumed to be purchased and dry corn was considered a homegrown feed. The rations were all balanced for 35L of milk at 4.2% BF. The mature haylage (14%) was valued at $60/tonne, the average haylage (18%) at $77/tonne, and the excellent quality haylage (22%) at $90/tonne.
The table below shows a breakdown of the as fed amounts for the 3 rations along with the ingredient costs.
Ration Comparisons When Feeding Different Quality Haylage:
These costs have been broken down further into homegrown and purchased feed costs, and further broken down to costs per cow per day, and cost per liter of milk. There are a few differences to note between the rations. Surprisingly, there’s only a difference of $0.40 per cow per day in total ration costs between the three rations. However, when you look at the difference in the purchased feed costs, there is a difference of almost $1.00/cow/day. This is due to the increased protein content of the higher quality haylage, but also due to the increased digestibility and lower level of indigestible fibre in the haylage allowing for a higher forage ration.
The total percent forage of these rations ranged from 48% to 61%. This allows for 1kg less soymeal and 2kgs less dry corn in the excellent haylage ration and a healthier higher forage ration for the cow.
Feed Cost Depending on Quality of Haylage Fed:
This article was written for the Spring 2024 Central & Atlantic Dairy Grist. To read the whole Dairy Grist, click the button below.